| Scorecard: | Australia v Sri Lanka |
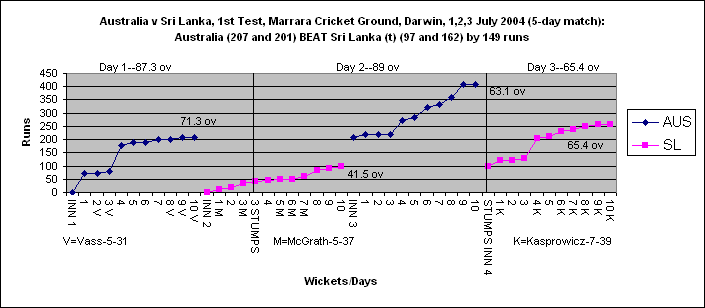
The graph below shows that Australia, after getting to a decent total of 177/3 on a seaming drop-in pitch, collapsed, losing 7 wickets for 30 runs. The graph is instructive in that it shows what partnerships look like on a linear scale. In a match with not a single 100 run partnership, Australia's two 50 run partnerships in 1st innings were enough to give them a platform from which to win the game, as things turned out.

These graphs will note any 100 run partnerships and any 5 wicket innings. In this case there were no 100 run partnerships, but three 5 wicket innings. Some milestones in the match included Glenn McGrath's 437th wicket, putting him in 3rd place on the all time list, Chaminda Vass' 250th wicket, and Jason Gillespie's 200th wicket. Interestingly of the 40 wickets to fall in 242.1 overs, 14 were to catches by the wicketkeeper, and 30 of the wickets went to fast bowlers. Was there something wrong with the drop-in pitch that gave too much assistance to the bowlers? You be the judge.
(Article: Copyright © 2004 Jack Solock)